A Comprehensive Guide to Dynamic Grafana Dashboards Using AWS CloudWatch
Introduction
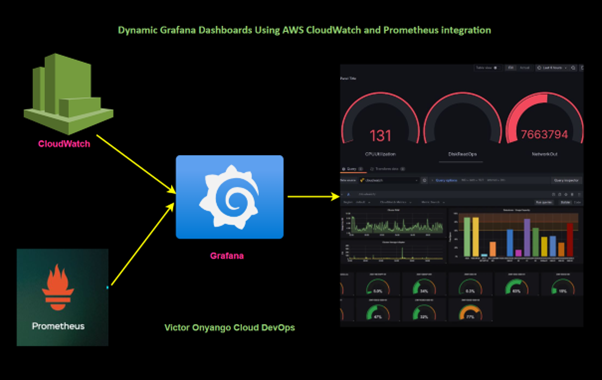
In today’s fast-paced cloud environments, real-time monitoring and visualization are key to ensuring your infrastructure operates efficiently. Grafana dashboards, when combined with AWS CloudWatch, offer a powerful solution for visualizing and analyzing data from your AWS services. In this blog, we will walk you through setting up Dynamic Grafana Dashboards using AWS CloudWatch metrics.
What is Grafana?
Grafana is an open-source platform designed for monitoring and observability. It allows users to query, visualize, alert, and explore metrics no matter where they are stored.
Why Use Grafana with AWS CloudWatch?
AWS CloudWatch is Amazon’s monitoring and observability service. While CloudWatch offers built-in visualization options, they can be limited in flexibility and customization. This is where Grafana dashboards come in.
With Grafana, you can:
- Create dynamic, interactive dashboards
- Visualize multiple data sources, including CloudWatch metrics
- Share and export dashboard views
- Build real-time monitoring dashboards that are highly customizable
Let’s get into the hands-on
We will first start by launching an EC2 instance.
To launch an EC2 instance for running Grafana, you can follow these steps:
Log in to the AWS Management Console
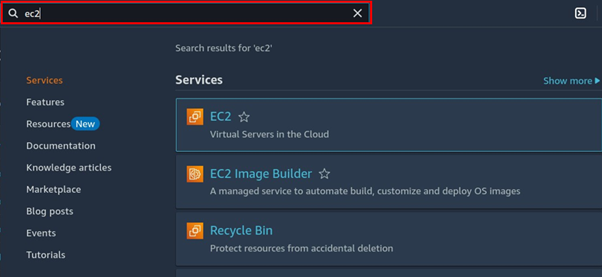
In the search bar type EC2 then select EC2 under services.
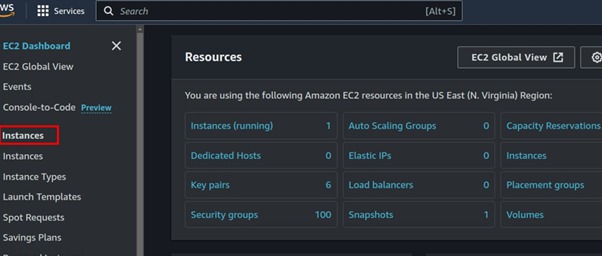
In the EC2 Dashboard, choose Instances from the navigation panel on the left side.
Click on the Launch Instances button.

Enter your preferred name for the instance in the name field.
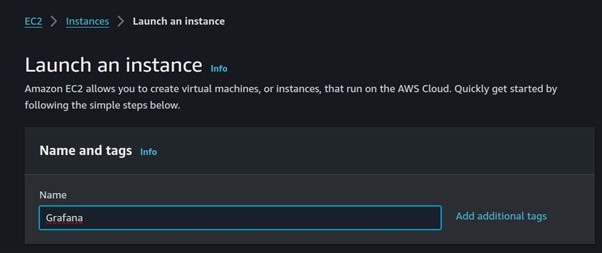
Enter your preferred name for the instance in the name field.
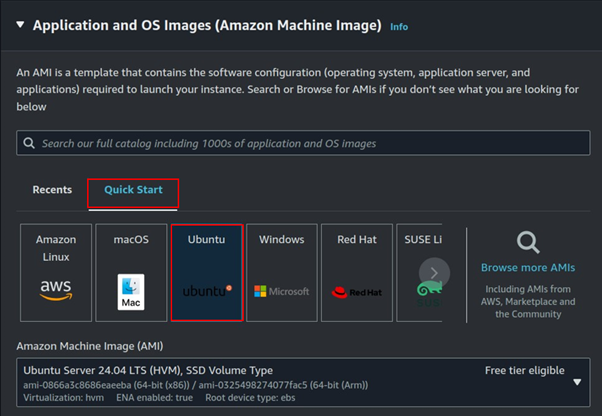
Under Application and OS Images, select the Quick Start tab, then choose your preferred AMI. For this setup, I will select Ubuntu.
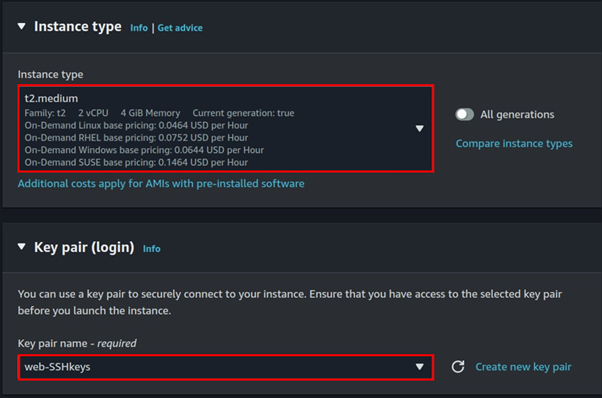
Under Instance Type, you can select t2. Micro, which is free tier eligible. However, for this project, I will choose t2. Medium.
Next, under Key Pair (login), select your existing key pair.
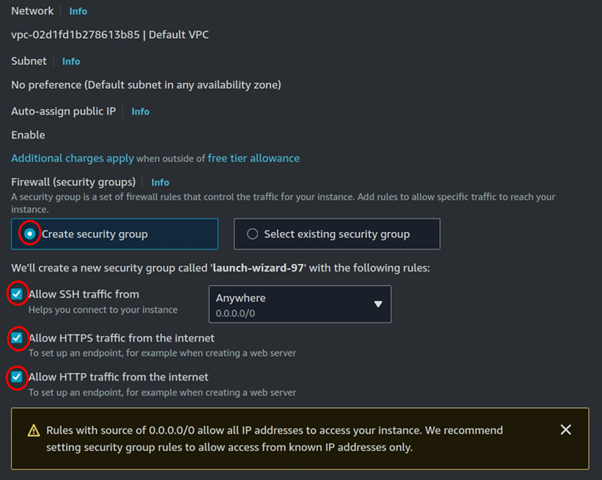
Under Firewall, select the Create New Security Group radio button. Then, open the following ports
- Port 22 for SSH
- Port 80 for HTTP
- Port 443 for HTTPS
Always follow best practices when configuring SSH ports by limiting access to your IP address.
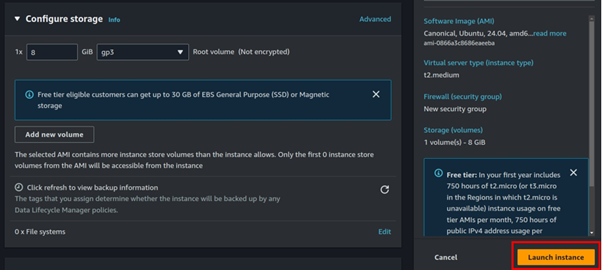
Leave storage as the default, then review it and click launch instance.
After launching the instance, adjust its security groups by opening port 3000 for Grafana.
Click on the Instance ID, then scroll down to the Security section. Next, click on the Security Group associated with the instance.

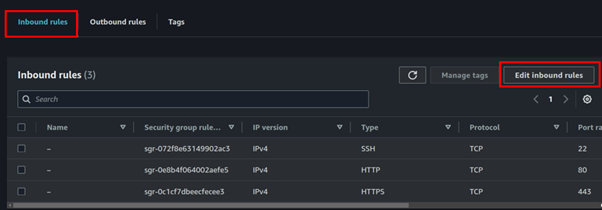
Go to the Inbound Rules tab and click on Edit Inbound Rules.
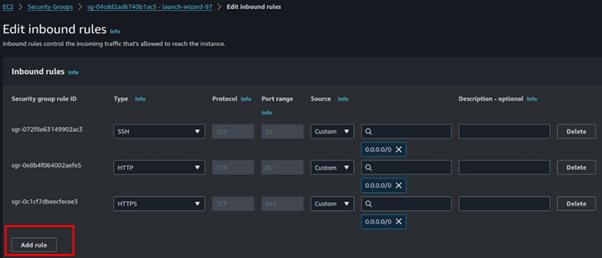
In the Edit Inbound Rules dashboard, click on Add Rule.
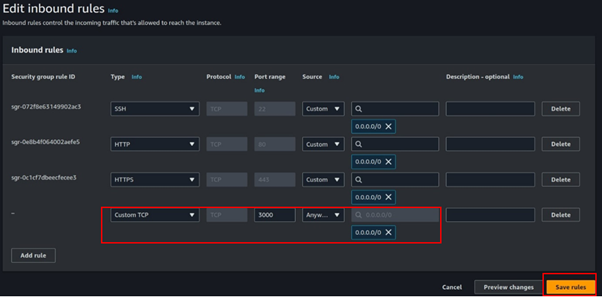
In the Port Range section, enter 3000, then click on Save Changes.
Now is the time to install Grafana, SSH into your instance by entering this command in your terminal.
# ssh -i <key.pem> user@publicIP
# your code should look like this.
ssh -i web-SSHkeys.pem ubuntu@44.212.29.235

Run the system update then paste in this command to install Grafana.
wget https://dl.grafana.com/enterprise/release/grafana-enterprise-11.1.0.linux-amd64.tar.gz tar -xvzf grafana-enterprise-11.1.0.linux-amd64.tar.gz cd grafana-v11.1.0/bin ./grafana-server &

Access Grafana: Open your web browser and navigate to http://<your-server-ip>:3000. Login using the default credentials (admin/admin).
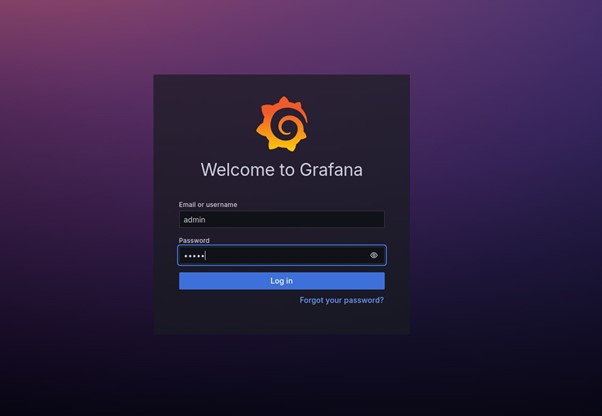
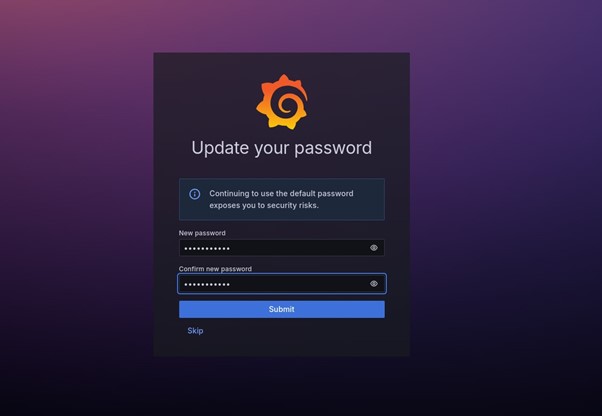
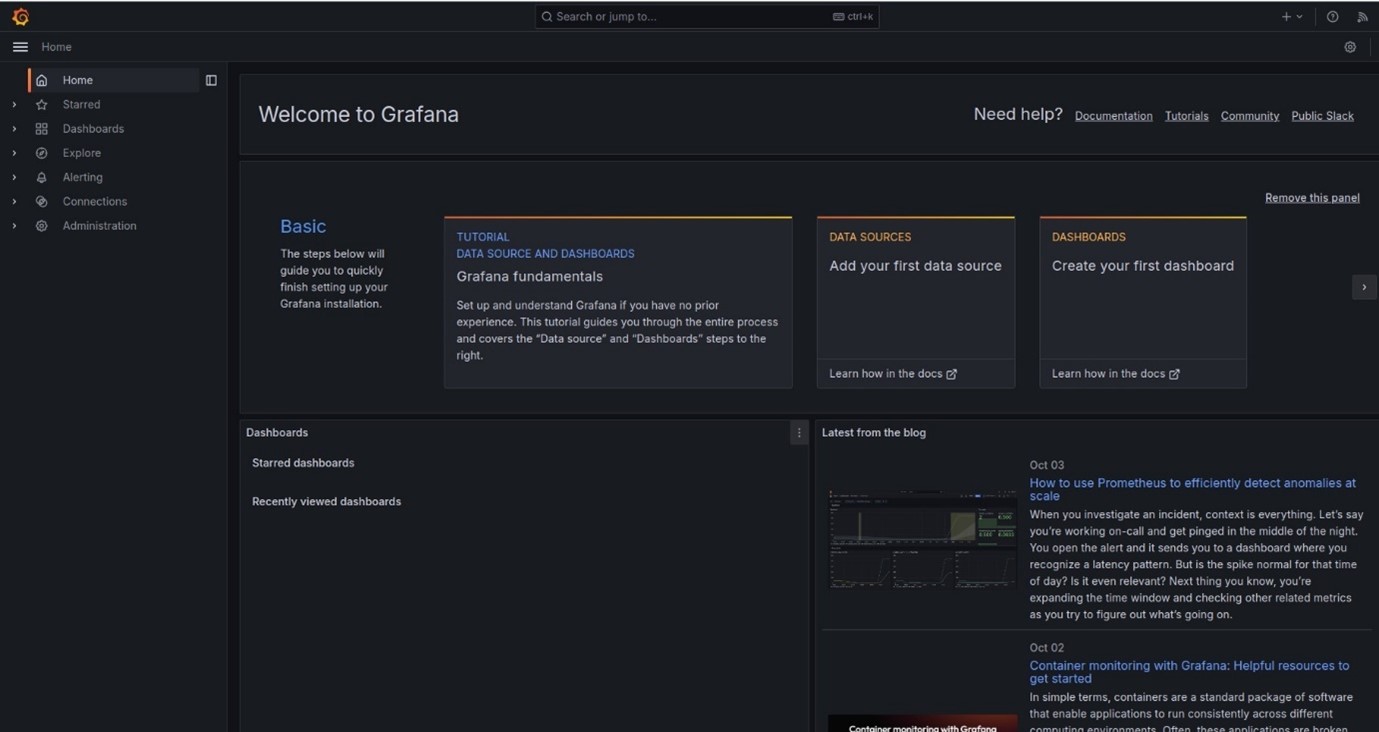
Update your new password then you will be logged in to your Grafana dashboard.
Adding CloudWatch as a Data Source
Grafana can integrate with AWS CloudWatch to visualize metrics from your AWS services.
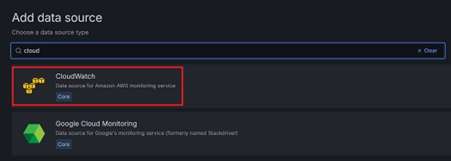
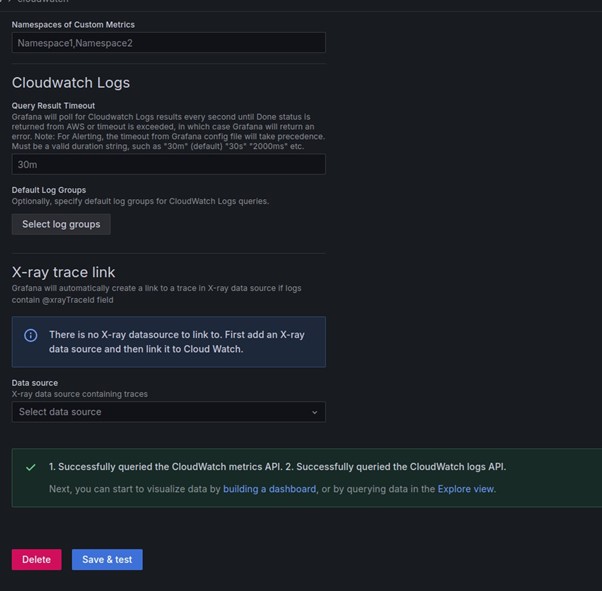
Add Data Source: In Grafana, go to the Left panel > Connections > Data Sources and click Add data source. Select CloudWatch from the list.


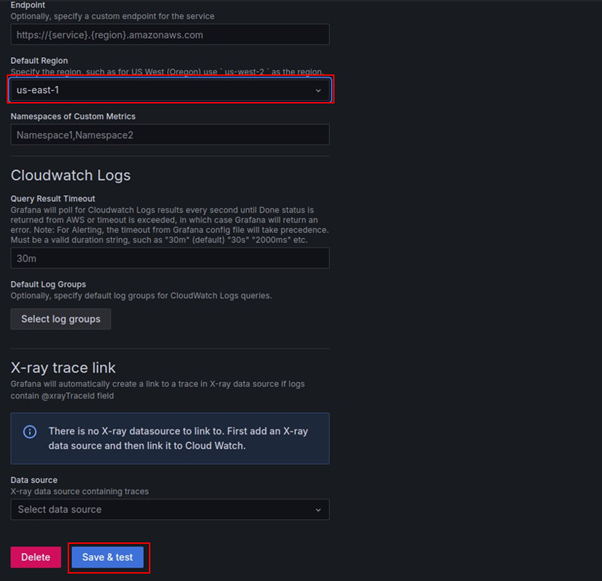
Configure CloudWatch: Enter your AWS credentials, specify the default region, and save the data source.
Creating a Dashboard for EC2 Metrics
Create Dashboard: Click on the Dashboards icon in the sidebar and select New.

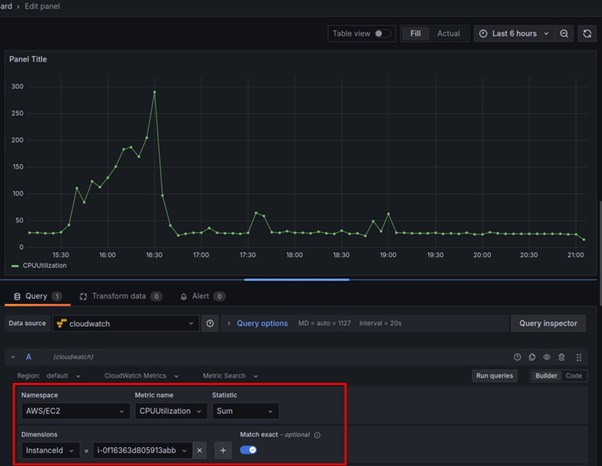
Add Panels: Click Add visualization, select CloudWatch-metrics as the data source, and configure queries to fetch metrics for your EC2 instances, such as CPU utilization and network traffic.

Here we have configured the first query to fetch CPU utilization of our EC2 instance running in our default region from CloudWatch.
Similarly, we will add additional queries to fetch other metrics for this instance from CloudWatch, such as Network In/Out or Status Checks.
Now save the dashboard by clicking on the save option in the right corner.
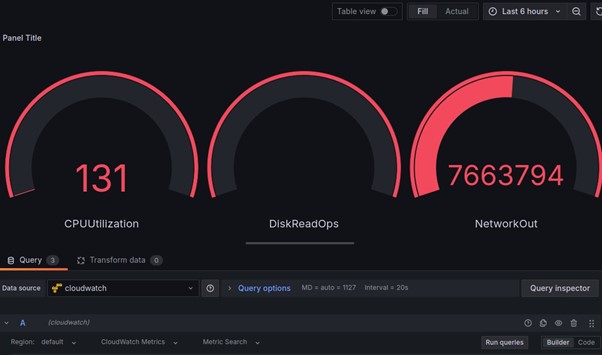
And that’s it! We have successfully achieved our objective by building a dynamic Grafana dashboard using AWS CloudWatch metrics.
Conclusion
Using Grafana dashboards with AWS CloudWatch provides real-time monitoring and valuable insights into your AWS infrastructure, helping optimize performance and manage costs effectively.
Thanks for reading and stay tuned for more. Make sure you clean up.
If you have any questions concerning this article or have an AWS project that requires our assistance, please reach out to us by leaving a comment below or email us at sales@accendnetworks.com.
Thank you!

Dichoso777? Yeah, I gave it a shot. Nothing crazy impressive, but it’s got its perks. Games are decent and the vibe is okay. You can find it at: dichoso777.
88OnlineCasino, another one with those lucky eights! Online casino, eh? Easy access from home. Let’s see what the buzz is about. Here the link: 88onlinecasino.
Kuwin789win huh? Well its online, and there are games. Its up to you, I did win once. Give it a try maybe: kuwin789win.
Just installed the ubet95app.net Betting app. Pretty good interface. I recommend it. Give it a look: ubet95app
Spinning the reels on 777win66 tonight. Fingers crossed for that lucky 7! Anyone else playing there? I am feeling lucky, check it out 777win66.
Got the RR888APK on my phone. Easy to download and install. So far so good. You wanna? Check out the apk download here: rr888apk
ST666press looks professional. I prefer sites that seem legit. What kind of info do they have? Might check it out for some industry news. st666press
nPjmC6xs2kN