Unlocking Application Insights and Debugging with AWS X-Ray

AWS X-Ray stands as a pivotal service within the AWS ecosystem offering developers deep insights into their application’s performance and operational issues. Moreover, it enables a comprehensive analysis of both distributed applications and microservices facilitating a seamless debugging process across various AWS services.
What is AWS X-Ray?

AWS X-Ray is a tool designed to aid developers in understanding how their applications operate within the AWS environment. It provides a detailed view of requests as they travel through your application, allowing for the identification of performance bottlenecks and pinpointing the root cause of issues.
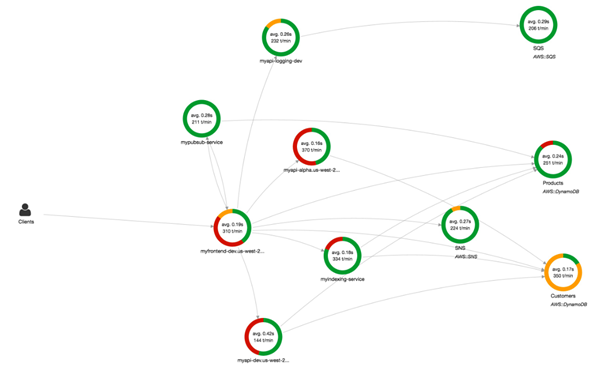
With the aid of a service map, AWS X-Ray visually depicts the interactions between services within an application, providing invaluable insights into the application’s architecture and behaviour.
How Does AWS X-Ray Work?
The functionality of AWS X-Ray can be broken down into a simple workflow that ensures detailed trace data collection and analysis. It starts with collecting traces from each component of your application, it then collects this data into what AWS refers to as traces. These traces then form a service map, offering a visual representation of the application’s architecture. This service map is crucial for analyzing application issues, as it provides detailed latency data, HTTP status, and other metadata for each service.

The Features and Benefits of AWS X-Ray
Simplified Setup
Getting started with AWS X-Ray is remarkably straightforward. Whether your application is running on EC2, ECS, Lambda, or Elastic Beanstalk. Integrating with X-Ray involves minimal configuration. This ease of setup ensures that developers can quickly start gaining insights into their applications without a steep learning curve.
End-to-End Tracing
One of the standout features of AWS X-Ray is its ability to offer an end-to-end view of requests made to your application. This application-driven view is instrumental in aggregating data from various services into a cohesive trace, thereby simplifying the debugging process.
Service Map Generation
At the heart of AWS X-Ray’s functionality is its service map feature. This automatically generated map provides a visual overview of your application’s architecture, highlighting the connections and interactions between different services and resources. It serves as a critical tool for identifying errors and performance issues within your application.
Practical Application and Analysis
Analysing Application Performance
AWS X-Ray shines when it comes to analyzing and improving your application’s performance. The service map and traces allow developers to drill down into specific services and paths, identifying where delays occur and optimizing them for better performance.
AWS X-Ray Core Concepts
Traces and Segments
At the core of AWS X-Ray’s functionality are traces and segments. A trace represents a single request made to your application, capturing all the actions and services that process the request. Segments, on the other hand, are pieces of the trace, representing individual operations or tasks performed by services within your application. For example, if a user uploads an image, the processing of that image by your application could be one segment of the trace of the user’s request.
Service Maps
Service maps visually represent the components of your application and how they interact with each other. By analyzing a service map, you can quickly identify which parts of your application are experiencing high latencies or errors. Think of it as a map of a city, where each service is a building, and the paths between them are the roads. The map shows you traffic flow and blockages, helping you navigate your application’s architecture more effectively.
AWS X-Ray Workflow
Data Collection
The first step in the AWS X-Ray workflow is data collection. As requests travel through your application, X-Ray collects data on these requests, creating traces. This data collection is automatic once you’ve integrated the X-Ray SDK with your application.
Data Processing
Once data is collected, AWS X-Ray processes it, organizing the information into a coherent structure that you can analyze. This processing stage is where traces are assembled, and service maps are generated, providing a comprehensive view of your application’s performance and interactions.
Data Analysis
The final stage is data analysis, where you, the developer, step in. Using the AWS X-Ray console, you can examine the traces and service maps, identify issues, and gain insights into how to improve your application. Whether it’s a slow database query or a faulty external API call, X-Ray helps you find and fix problems fast.
Integrating AWS X-Ray with Other AWS Services
AWS X-Ray seamlessly integrates with various AWS services, enhancing its tracing capabilities. When you use AWS Lambda, EC2, or Amazon ECS, integrating X-Ray allows you to trace requests as they move through these services, providing a unified view of your application’s performance across the AWS ecosystem.
AWS X-Ray is a valuable tool for developers and operations teams looking to improve the performance, reliability, and troubleshooting of their applications running on AWS. It’s particularly useful in microservices architectures where understanding dependencies and performance across services is crucial.
Thanks for reading and stay tuned for more.
If you have any questions concerning this article or have an AWS project that requires our assistance, please reach out to us by leaving a comment below or email us at sales@accendnetworks.com.
Thank you!
