Deep Dive into CloudFront: Understanding Internal Caching Mechanisms and Implementing Websites on S3 with Region Failover Part One
Amazon CloudFront, a Content Delivery Network (CDN) provided by AWS, is key in ensuring that content is delivered swiftly to users across the globe. When paired with S3, it’s perfect for hosting fast, secure, and reliable static websites. In this article, we will explore CloudFront’s internal caching mechanisms and discuss how to implement an S3-hosted website with region failover capabilities.
What is CloudFront
CloudFront is a CDN service (Content delivery network). CloudFront caches content such as HTML, CSS, and dynamic content to a worldwide data center called Edge Location or Regional Edge location. it is used to boost your website performance by availing content closer to users all over the world.
How it works?
CloudFront caches the contents in all the edge locations around the world. Caching refers to storing frequently accessed data in high-speed hardware, allowing for faster retrieval. This hardware is known as a cache. However, caches have limited memory capacity, and it is not possible to store everything in them due to their relatively expensive hardware. We use caching strategically to maximize performance.
Cache Hierarchy in CloudFront
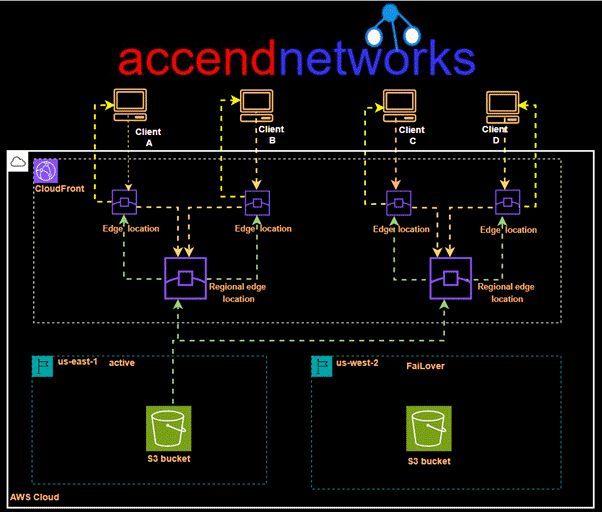
Regional Edge Caches: Before content reaches the edge locations, it may pass through regional edge caches. These are a middle layer that provides additional caching, helping to reduce the load on the origin server and improve cache hit ratios.
Cache Hit: This refers to a situation where the requested data is already present in the cache. It improves performance by avoiding the need to fetch the data from the source such as a disk or server. Cache hits are desirable because they accelerate the retrieval process and contribute to overall system efficiency.
Cache Miss: This occurs when the requested data is not found in the cache. When a cache miss happens, the system needs to fetch the data from the source, which can involve a longer retrieval time and higher latency compared to a cache hit. The data is then stored in the cache for future access, improving subsequent performance if the same data is requested again. Cache misses are inevitable and can happen due to various reasons, such as accessing new data or when the data in the cache has expired.
How CloudFront utilizes caching to reduce the latency and increase the performance
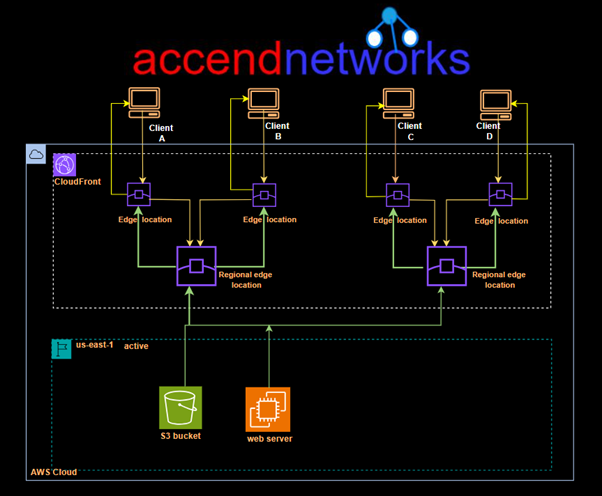
When a user requests a website, the DNS service resolves to the DNS of the CloudFront distribution, which then redirects the user to the nearest edge location. The user receives the response from that particular edge location. However, there are instances when the requested data is not present in the edge location, resulting in a cache miss. In such cases, the request is sent from the regional edge location, and the user receives the data from there if it is available, indicating a cache hit. However, this process can take some time.
In situations where the data is not present in the regional edge location either, retrieving the data becomes a lengthier process. In such cases, the data needs to be fetched from the origin server, which, in our case, is the S3 bucket. This additional step of fetching the data from the origin server can introduce latency and increase the overall response time for the user.
CloudFront origin failover
For high-availability applications where downtime is not an option, CloudFront origin failover ensures that your content remains accessible even if the primary origin server becomes unavailable. By setting up multiple origins (like two S3 buckets in different regions) and configuring CloudFront to switch to a backup origin when the primary one fails, we can maintain uninterrupted service for users, enhancing our website’s reliability and resilience.
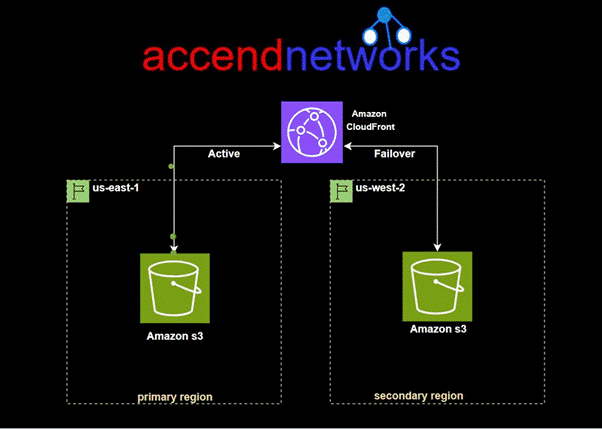

For CloudFront origin to be achieved, we create an origin group with two origins: a primary and a secondary. If the primary origin is unavailable or returns specific HTTP response status codes that indicate a failure, CloudFront automatically switches to the secondary origin.
To set up origin failover, you must have a distribution with at least two origins. Next, you create an origin group for your distribution that includes two origins, setting one as the primary. Finally, you create or update a cache behavior to use the origin group. We will demonstrate this with a hands-on in the second part of this blog.
Thanks for reading and stay tuned for more.
If you have any questions concerning this article or have an AWS project that requires our assistance, please reach out to us by leaving a comment below or email us at sales@accendnetworks.com.
Thank you!